
WE SLICE AND DICE IT ALL FOR YOU
Our event reporting provides detailed data you can use to track results and make changes on the fly. At a glance, you have a full picture of each event: leads generated, traffic counts, visitor opinions, sales resulting from leads, even what customer emails have been opened. We provide all the metrics you need to measure ROI and justify your investment in terms of dollars (and sense). Bosses like that.
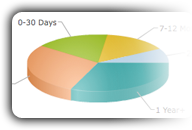
PURCHASE HORIZON RATIOS
This pie chart shows how soon prospects plan to buy. You'll know just when to follow up with a message or special offer. It's easier to seize the future when you can see it.
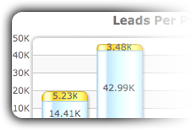
Leads per Program
With each program (event), we crunch the numbers on leads delivered. You can compare results from different programs, venues and previous years. In one quick snapshot.
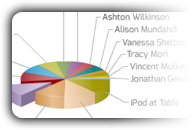
LEADS PER SOURCE
Who is bringing in the most leads for you? What makes them so successful? Find out who your top performers are and how they do it. Skills are transferable.
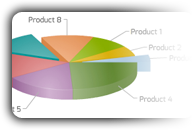
MODELS OF INTEREST RATIOS
Which of your products are most popular with show visitors? Use our data to adjust your marketing and forecast demand. Spot trends early.
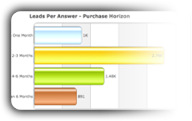
LEADS PER ANSWER
Good questions open the door to great leads. Review the responses you receive and see which questions work best. We can match back responses with sales results.
ShowMax has proven to be an ideal partner; they continually amaze me with their talented and bright staff, creativity and technology. I can always count on ShowMax for exceptional product specialists, creative solutions and cutting edge lead generation. 
Todd Lawrence
Promotions and
Subaru of North America
Our best work? It's behind the scenes... in the data we collect for brand-critical clients.

subaru of north america
- Real-time data capture
- Data analytics
- CRM integration
- Custom reporting suite

toyota motor sales, USA
- Real-time data capture
- Data analytics
- CRM integration
- Custom reporting suite

Volvo of North America
- Real-time data capture
- Data analytics
- CRM integration
- Custom reporting suite